Reports
FitLins generates summary reports, written to <output dir>/fitlins/reports/.
This directory contains a report for each unit of analysis, with visualizations
of design matrices and statistical outputs.
View example report.
Visualizations
Design matrices
Examining the design matrix is a quick visual indicator of whether your model was correctly constructed. Task regressors should be predictable, given the study design, and, in the case of this example, we see a clear block design pattern.

The design matrix constructed from the BIDS model. The columns correspond to regressors, or explanatory variables, and the rows correspond to BOLD volumes. Cosine drift and constant regressors are added to account for low-frequency components.
Regressor correlation matrices
Regressor correlation matrices are provided in order to diagnose collinearities in the design matrix. High correlations among variables of interest or between variables of interest and nuisance regressors are cause for concern, as the GLM will not be able to distinguish signal attributable to one regressor from that attributable to a collinear regressor.

Correlations between regressors are plotted. Bold black lines separate variables that are included in contrasts, or variables of interest, and variables that are not, or nuisance regressors.
Contrast matrices

Contrast matrices show the variable weightings for each contrast.
Glass brain plots
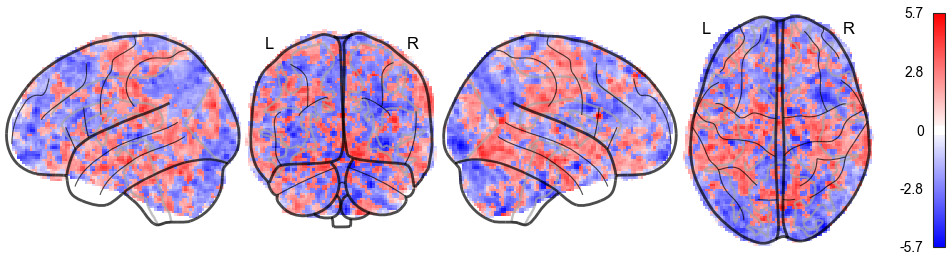
Glass brains, or maximum-intensity projections, show the highest absolute value along the viewing axis at each point in the viewing plane. Large patterns will be evident in this view.
Naming decisions
For reporting purposes, FitLins performs some minor reformatting of contrast
names.
If _gt_ is found, for example, FitLins will display it in the report
document (although not the figures) as >.
Similarly, _lt_ and _vs_ become < and “vs.”, respectively.
See the example report for examples.